

The Math: How Cycle Times Creates Profit
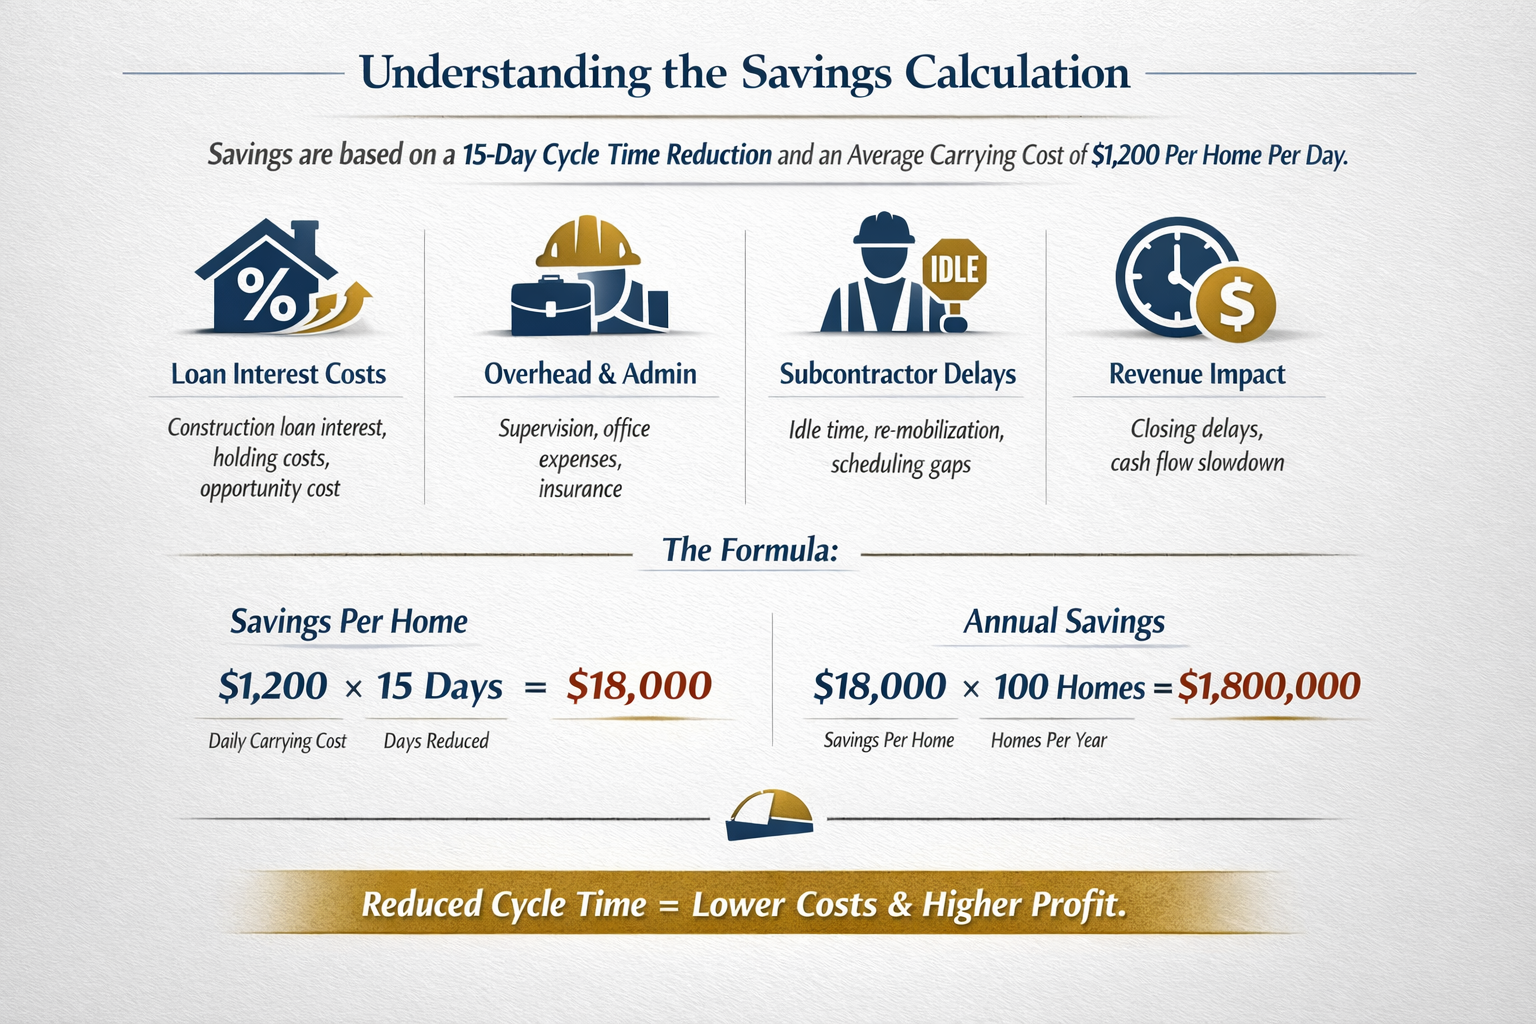
What’s Included in Daily Carrying Cost?
Daily carrying cost typically includes construction loan interest, overhead allocation, subcontractor downtime/remobilization, and delayed revenue velocity.
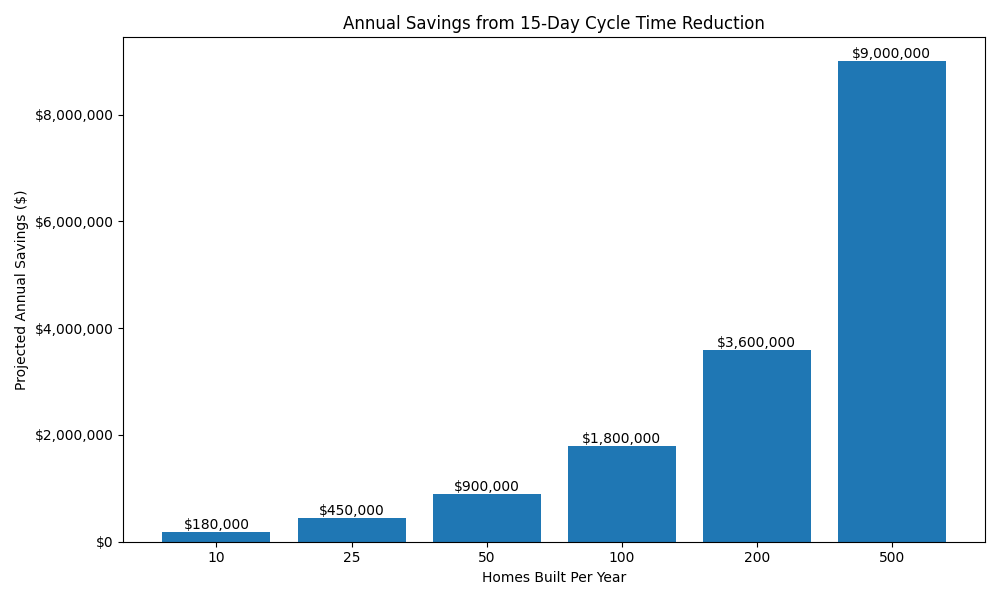
(The numbers in the chart (right) reflect conservative carrying-cost savings and do not include secondary upside).
Cycle Time isn’t a schedule problem. It’s a financial lever. Every additional day a home stays in construction increases carrying costs, delays revenue, and compounds operational friction.
Annual Savings = (Homes Built Per Year) x (Days Reduced) x (Daily Carry Cost)
Cycle Time Reduction: 15 Days is the goal
(Your results may vary by home price, interest rate, overhead, and production model)
Why a 15-Day Reduction is Realistic
We reduce cycle time through:
Milestone discipline (clear targets + accountability)
Lead-time precision (order timing aligned to schedule)
Inspection discipline (requests scheduled proactively)
Subcontractor coordination (confirmations + sequencing)
Purchasing + vendor alignment (stop surprises)
Field execution structure (superintendent daily operating system)
Assumptions: $1,200/day × 15 days = $18,000 saved per home
10 homes/year: $18,000 × 10 = $180,000
25 homes/year: $18,000 × 25 = $450,000
50 homes/year: $18,000 × 50 = $900,000
100 homes/year: $18,000 × 100 = $1,800,000
200 homes/year: $18,000 × 200 = $3,600,000
500 homes/year: $18,000 × 500 = $9,000,000